Michael's Blog of the Digital Past

Just another onMason site

Michael's Blog of the Digital Past

1913 Natives Land Act Power Point

In South African history, one of the most important pieces of legislation that set up the system of Segregation and laid the foundations of the later Apartheid was the 1913 Natives Land Act. This act restricted the land rights of many black Africans, condemning them to marginal land and setting up a system of coercion and control, all in the name of white dominance. What historical processes led to this act being passed? An analysis of Rudolph Daniels piece entitled, “The Agrarian Land Question in South Africa in Its Historical Context, 1652-1988” will show that the precedent for this act began in the early years of colonization, when whites forced blacks to live on marginal land either through conquest or treaty. Then, in the late 1800’s, a series of squatter laws cropped up throughout South Africa in response to the perceived serious threat of squatting – the practice of a person, in this case a farmer, utilizing land for his own purposes without paying taxes or rent. According to Daniels, then, the 1913 Natives Land Act was partially an attempt to deal with squatters, both to increase the labor pool, and to increase the output of farms. However, Harvey M. Feinberg shows in his text, “The 1913 Natives Land Act in South Africa: Politics, Race, and Segregation in the Early 20th Century” that the most important proponent of the law was Prime Minister Botha’s government who, in an attempt to retain party unity within the South African Party, pushed for the law to be passed to appease the radical elements from the Orange Free State delegation in Parliament led by parliamentary member Hertzog. Though the act eventually failed to keep the South African Party united, it was not repealed or significantly altered as it served its purpose of legalized white domination, underscored the inferiority of blacks, and encouraged labor for industry and the mines.

Daniels points out that there was a long historical tradition of segregation between Europeans and Africans, and that this view was traditionally seen as the best alternative to direct living. This was known as the “natural policy” and it was first implemented following the trekker migrations away from Cape Town and into the mainland. When the trekkers encountered a native people group, they would force them away by treaty or military domination. As Daniels points out “This was sometimes accompanied by violence and war, but much more frequently it was a silent process… Possession meant different things to Europeans and to Africans.” To a European, possession meant the legal rights to the property, physically owning it. To an African, it simply meant the right for temporary use. Thus, when Europeans signed treaties pushing Africans out of Europeans desired farmland, it was easy to coerce Africans. Those who realized what was happening and resisted were attacked militarily. The result was the creation of “reservations” wherein blacks were allowed to live as they pleased but only so long as whites approved and had no need of their land or resources. These reservations were common place in the Boer republics of the Transvaal and Orange Free State in the 1850’s, a significance that will be explored later (Daniels 328-329).

Meanwhile, the British also practiced segregation and the “natural policy” when they came to rule the cape colony throughout the early- to mid-1800’s, though unlike the Boer’s who viewed it as a policy of conquest and domination, the British saw it as the simplest way to deal with the “native question.” If natives were pushed out of the way and allowed to live as they pleased, it would solve the problem of assimilation. The British also used segregation and the establishment of reserves to create buffers between hostile tribes and colonial farmers. They would recruit remnants from conquered tribes and set them up on their own tribal lands. Thus the “natural policy” was seen both as a humanitarian solution and an act of cultural domination (Daniels 330-331).

With the advent of the industrial revolution, sparked by the discovery of diamonds in Kimberley in 1867 and gold in the Witwatersrand in 1886, the relatively strict use of “natural policy” was abolished as whites looked for cheap labor to work in their mines. Moving Africans out of their reservations and away from their families was accomplished through two main avenues: the establishment of labor recruitment agencies and a series of new taxes proposed from 1890-1895 on rural Africans forcing them to find labor. However, the migration of blacks off of their reservations created new problems with squatters – blacks who utilize white owned-land or Crown Land without paying rent or taxes or refuse to receive wages for their labor and instead have private, entrepreneurial goals. The various colonies and the two Boer Republics attempted to combat this with anti-squatter laws, but by and large these laws were ineffective because they required the use of violence to coerce blacks into either becoming laborers. This often hurt the labor pool, making them unpopular with white farmers who required labor to farm effectively. Thus the laws went unenforced. Except for the Cape Colony, which imposed a law that forced squatters to work as farm laborers or else they had to pay a steep tax (Daniels 331-333).

The final element of the historical processes leading up to the 1913 Natives Land Act discussed by Daniels was the need for increased farm production. As the industrial revolution was ramping up, it put more demands on white farmers. These farmers began fencing off their land, preventing blacks from squatting on it. This caused two things: it exacerbated the squatting problem, and it encroached on blacks land, forcing them on more marginal land within their reservations. This land became overworked, depleting the soil, and causing an agricultural crisis. Daniels points out that, rather than raising concern, this phenomenon was looked upon favorably by the white community, as it became another factor among the forces that increased the labor pool with blacks. With the increased problem of squatting, and the value of the increase in labor, these issues were seen as something that had to be solved by the new government of the Union of South Africa (Daniels 334-335).

Feinberg begins an analysis of the political climate surrounding the bill. According to Feinberg, the reason the 1913 Natives Land Act was passed at that particular historical juncture with the language it contained had very little to do with economic conditions or squatters, but instead because of the hostile political climate between Prime Minister Louis Botha and Member of Parliament James Barry Munnik Hertzog. In 1910, the first election of the new Union of South Africa took place. Britain appointed Louis Botha to be the first Prime Minister of South Africa. Botha had the difficult task of creating a sustainable government out of the majority party, the South African Party, which itself was a coalition of progressive-liberal politicians from the Cape Province and more aggressive and reactionary politicians from the Boer provinces. Botha was hesitant to give Hertzog a Cabinet post due to his more radical ideologies, however, when Hertzog refused to approve an appeals court judge, Botha was forced to accept him onto the Cabinet. Unfortunately, over the next two years, relations remained tenuous. Hertzog was an unapologetic Afrikaner nationalist from the Orange Free State, who, among other things, demanded that Afrikans be the primary language of South Africa, and barring this, that it should be of equal importance to English. On top of this, Hertzog desired a “South Africa first” policy, whereby South Africa would retain the right to choose whether or not to support the British depending on the situation. Complicating matters, Hertzog was not afraid to promote his ideologies, even if it meant usurping the prime ministers authority. Often acting of his own accord, he said things that contradicted the official party view, often at inappropriate moments, causing political backlash and embarrassing Botha. In response to Hertzog’s rash actions and statements, Botha and the rest of the cabinet resigned. Following this, the governor-general of the dominion requested Botha to form a new cabinet, of which Hertzog was not a member (Feinberg 70-80) .

The loss of Hertzog had to be carefully politically calculated. In 1910, the South African Party had won 67 seats, while the Unionists and won 39, the Labour Party 4, and 11 independents. Thus the South African Party’s held a majority by 13 seats (67-54). Meanwhile, sixteen South African Party members fell into Hertzog’s camp. Hertzog would only need to convince 6 of these sixteen members to follow him in leaving the South African Party and force the creation of a new government. How could Botha appease these members and maintain his government? The answer was by passing some of their radical Boer legislation (Feinberg 79).

The 1913 Natives Land Act was presented by Sauer, a member of Botha’s cabinet who was actually a Cape liberal who believed in the expansion of voting rights among blacks. The act appears to have followed not only the outline of the previous act dealing with squatters in the Cape, but it also followed the architecture of a draft bill rumored to have been proposed by Hertzog. This was clearly an attempt to appease the more radical Boer elements in parliament, especially because, rather than being a law that dealt strictly with squatters, it also prohibited the sale of land to blacks. This was a law that, at the time, only existed in the Orange Free State. By including it in the law, it was hoped to appease Orange Free State politicians, which made up the 16 members of parliament in Hertzog’s camp, by extending part of the radical Afrikans ideology which existed there throughout South Africa. Thus, to keep the party together and prevent a national crisis, the act had to be accepted (Feinberg 79-80).

Wordle: 1913 Natives Land Act

a wordle of the 1913 Natives Land Act. Notice that “Orange” is present.

Finally, the bill was found agreeable by a myriad of politicians because the main “principle” of the bill, according to 15 of the 17 people who discussed it’s “principle”, was for segregation. Many newspapers, journals, and magazines agreed, such as the South African Agricultural Journal, which claimed the bills push was “to provide lines of demarcation between natives and non-natives.” Nearly all of the white members of parliament believed Segregation was a good idea, even if they may not have agreed on the prohibition of land and the outright oppression of blacks. When confronted with the topic of Segregation, many politicians favored it, believing that it would allow Africans to continue their traditions and develop on their own. Even John Dube, founder of the South African Native National Congress, wasn’t against the concept, as long as it was a fair division of land. Lastly, the many politicians agreed to pass the bill because of a list of exemptions. The Cape Province was exempted from almost the entire bill since it contained one of the highest black populations, among them free black “amakholwa” who were given the right to vote. Meanwhile, the Transvaal and Natal didn’t have the harsh anti-squatting elements of the bill. With these provisions, the bill was passed on June 19, 1913 (Feinberg 103-105).

Wordle: John Dube's Letter

A wordle of John Dube’s letter to the British Public

While a knowledge of the historic processes that led to the passing of the Natives Land Act and the politicians intentions in passing the act is valuable, it’s also important to discuss what wasn’t intentional. One speculation is that the bill was passed to increase the labor pool for the industrialized society. However, there is very little evidence for this. Many of the few members of Parliament that discussed the bill worried that it would actually lower the amount of labor available, since Africans would have access to their own designated land. Meanwhile, private enterprises, such as mining organizations, hardly paid attention to the bill, showing no interest in its passing. Feinberg states, “The Annual Report of the Chamber of Mines for 1913 does not list the Natives Land Act among acts ‘of interest to the mining industry.’” (Feinberg 105-109)

The South African parliament passed the act based on historical precedence, response to societal problems, and political pressures. For much of South Africa’s colonial history, demarcating territory for blacks took place. This “natural policy” established a precedent that made segregation acceptable not only to the white politicians, but some black leaders such as John Dube (though it had to be “fair”). As the industrial revolution kicked off, squatters became a serious issue. In response, a series of acts were passed, culminating in the 1913 Natives Land Act. However, the Act was worded in such a way as to appease the more radical members of the South African Party, thus aiming to retain party unity. This political maneuvering was the primary basis for the act at the time it was passed.

_______________________________________________________________________________________

To preserve this piece, I would save all relevant files to my computer, a USB flash drive, a portable harddrive, and a cloud storage. I would ensure that my flash drive and harddrive were not all in the same place in case it some how got damaged. I could also save it in more than one format; for example, I have a power point and microsoft word document. Thus, by having this on my computer and blog, I inadvertently have helped “preserve” it.

Photos on power point can be found:

Here

Here

And here

Scratch and Practicum

First of all, I think it’s great that they’re creating something like Scratch, a programming language for children. As someone in his early 20’s who avidly uses technology on a daily basis, learning some form of programming for business purposes or personal purposes (read: creating mod’s for games/assisting a friend in the development of a game for Android) has piqued my interest. However, programming is incredibly intimidating, primarily because of the use of logic and seemingly nonsensical systems that govern it. Scratch, being a water’d down version of any other programming language, creates an easy entry point for new comers like me to begin learning the basics of programming. More importantly, however, Scratch is a system that can be easily learned and mastered by children. Thus, where I am completely lost in the whimsical world of programming, today’s children can grow up learning about programming as a part of the every day, enabling them to become the computer wizards of tomorrow at potentially, significantly less effort than I would have to make.

I messed around with it a bit and made a talking cat play Mary Had a Little Lamb. What was amazing was that I could change the tempo and instrument, and even program the cat to do a sort of dance while it played.

For the maze, I did move forward, turn left, move forward, move forward, if wall ahead do turn right, move forward, move forward, turn left, move forward, move forward, turn right, move forward, turn left, move forward.

I thought that the logic language was somewhat limited. for example, it would have been convenient if they had a logic statement that was something like “if at intersection” or something. It just seemed oddly lacking.

Finally, I would like to bring up a very important issue. What relevance does this have to our history course/producing digital works of history? I can think of some solutions to this answer: for example, we may want to produce our own little animations using programs like scratch or we may need to program certain things in the creation of a website, but this has not been explicitly discussed in class.

Practicum: Creating a Preservation Path

One problem with creating a preservation path is that it requires continual renewal of the digital material being preserved. Personally, this would make creating a preservation path an annoyance, particularly with personal documents. Nevertheless, preservation paths seem to be pretty easy to create. Here’s the steps I’d take:

  • Keep and maintain all relevant files regarding important documents such as papers, photos, music, digital media (video games, movies, etc.) on my main hard drive
  •  This would include all rough drafts and revised drafts. Especially when it came to my academic papers, having rough drafts could be of historical significance in the future
  • Take all the sensitive material and copy them to at least one portable hard drive. In addition, creating CD’s of music or copying some items onto multiple flash drives would be preferred.
  • Copy said information onto at least one cloud source. More than one cloud source could be preferred for a variety of reasons: it would increase security (if iCloud was hacked but all my sensitive information was on Amazon’s cloud service, it would help), save space on cloud services that require a payment if you use over a certain amount of space, and some cloud services could be more convenient than others for certain media (Steam, for example, can back up information to all your games linked to your steam account)
  • Lastly, for certain information, it may be best to produce hard copies, such as tax records, bill statements, photos, and music (CD’s)
  • Depending on the files in question, I would semi-annually check to make sure they are still accessible. Certain files, such as tax records, would probably be very important to check, while others, such as music, would probably be check per my own self interest
  • About every 5 years (aka: when I get a new computer ever 3-5 years), I would make new copies/update the old copies. Updating them could mean, for example, taking an old microsoft word document originally written in a previous version, downloading it, updating it with the newer version of microsoft word, and then uploading it back to a cloud service

Preserving the Digital Future

While reading Roy Rosenzweig’s article on preservation  he makes a point of saying that historians used to practice preserving the present for the future as much as studying the past and how it shaped the present. He believes historians, along with archivists, should take a more active role in preserving the present. While I believe historians should certainly be more proactive in preservation by being aware of different mediums and which ones could be best preserved (don’t create a digital historical work using a programming language that isn’t used anymore, for example), I believe that do to the wealth of information being created on a daily basis, the split between archivists and historians should remain. Perhaps an open forum should be created, so that historians can help archivists create catalogs of current works that would be logically accessible to future historians, but I do not believe that the responsibility of preservation rests on historians. Right now, us historians are like a diner in a restaurant, while the archivists are the cooks, and the internet is our server (HAH!). Historians right now need to concern themselves with what they order (do we create such a work in a digital formate? if we do, what format would best accomplish what it is we’re trying to say? Do we add hypertextuality and interactivity, along with photos, videos, and audio clips, or would that be overkill for what our arguments would be?). The archivist takes all the ingredients, mixes them together, and bakes a cake. The hope is that the cake will not just be good enough for us to eat, but for us to serve to any other historians that want to enjoy that cake, at any other point in time. The problem is that the server, the medium through which we access our delicacies, can change. If he changes, will he even understand what a “cake” is? So the problem is that archivist need to make sure they keep all the ingredients to bake a cake, while the server has to be able to recognize what a cake even is! Yet, again, this analogy shows that the historians role in preservation is limited. We need to be aware that we’re the one’s ordering the cake, prescribing what ingredients should be used in it, but we need to trust archivists to always make it the right way, again and again. If we require them to add some especially rare ingredient, eventually they’ll “run out” and the cake will be doomed. I feel like that’s all us historians should be concerned with.

Practicum: Using Google Ngram: “A horse! A horse! My kingdom for a horse!”

For my Google Ngram, I looked at the word horse in relation to the words car and train. The first interesting tidbit has to do with horse itself – why in the early 1700’s was there such an explosion of the word “horse”? Horses have been domesticated for 5000-6000 years, and they’ve been known as the “noblest of beasts” since at least the time of the Greeks. So why was there such an explosion?

(cause everyone can use a little horse dancing)

It turns out that there actually is a correlation to Gangnam Style. Psy was a virtual unknown outside of Korea before his popular music video debut over the summer. Today it has over 718 million hits. In the span of a few months, Psy has become famous. The effects of his music could have ramifications for music across the world – at the very least, it probably opened up an avenue for Korean music to leak into the American lexicon.

Similarly, the explosion in the use of the word “horse” has to do with three famous horses born in the 1710s, chiefly Flying Childers, arguably the first great racehorse ever (or at least in the English speaking world). In 1720, Childers won his first race, coinciding with the first major explosion. This, coupled with the promotion of the sport by Queen Anne from 1700-1714, made horse racing the chosen pasttime of the English elite. Fast forward to 1752, and a new governing body for the race, the Jockey Club, was established to help create rules and regulations for the new sport. This coincides with the largest increase in the number of times the word was used since 1700. From 1760 onward, the usage of the word horse stayed relatively consistent (around the .0096% mark) until 1900 (a feat that’s quite remarkable considering that throughout the time period more books were being published, meaning the usage of the word likely increased).

Car and train were both used relatively consistently throughout the 1700s and into the mid 1800s. In the case of train, this likely has to do with the varying definitions train carries (from an orderly procession to the very old definition of “betrayal” or “trickery”). Car was essentially shorthand for “carriage” and in fact is celtic in origin.

What’s interesting is that train began a steady climb beginning in 1860 (around which time many of the first major railways were being completed). At this point, the usage of the word horse steadily declined, though it still remained near .0096%. It wasn’t until cars became very popular that horse truly began to lose it’s popularity – by 1919, horse was at it’s lowest point in almost 2 centuries. In 1940, car finally began to overtake the usage of horse. This could possibly be do to the great depression – though few people were capable of owning cars at this point in time, the extreme social engineering many western governments undertook over the course of the economic calamity may have persuaded people of the cultural importance a car had. Car struggled to maintain its usage over the next 24 years, until 1964 when car began a steady climb that continued until the early 2000’s. This was probably do to the construction of the American interstate highway system – the first state to complete their high way system was Nebraska in 1974. The construction continued into the 1990’s, helping to boost car’s popularity usage, rising to similar prominence as “horse”, climbing to around .0096%. Why had car declined in the 2000’s? Possibly because of the rising popularity in the green movement.

Trains on the other hand have risen in popularity since 1995.

Interestingly, in the last decade, horse has had a sudden revival. It’s the most dramatic incline since the 1800’s. This could be do to some of the famous horses that have raced in the last decade, but it could also be do to the rising wealth disparity in the United States – the wealth disparity that has existed over the last decade is among the greatest in history.

Practicum: Create a slide show

This is just an example of a power point I tried to make. I really don’t like power point and I think I’ll try something like privy next time. After an hour of trying different things, I have 2 slides, the results of which I am not very impressed with.


The 2nd Boer War

The problem with APIs: Over-generalization

Dr. Cohen’s article on data mining has several excellent points. For example, having a more comprehensive, humanities-only API/data-mining tool would yield more and better results than a sufficient search using Google’s engine. It’s also interesting to note that free resources can provide better quality data, because these resources can be manipulated more easily, unlike Google’s library of scanned books.

Now first, I would like to stop here for a second and analyze what Dr. Cohen means by this. I believe he means that using a resource such as wikipedia could help us data mine information on a subject and more easily correlate how that subject relates to a different subject. For example, Dr. Cohen talks about George W. Bush and how we might be able to distinguish him from his father. Google’s library scanning program might let you know which books have the word “Bush” in them, and an exhaustive cross referencing of terms including “the President”, “Iraq”, etc. may help us further distinguish the second president from his father, yet having a more manipulative source would make it easier to use different algorithms to find answers to these questions more quickly. At least, I think. Frankly, how it is more easily manipulated is something I’m not sure I understand and would love some clarification on.

Another issue I’d like to bring up is: Why is it better to have a large quantity of articles in your database verses a few qualitative articles? When I first read this, I assumed Dr. Cohen was referring to a QA model, where a search engine such as H-bot might be able to answer your question based on what the majority of the internet says. Or, you could grasp the general scope of a particular event in history based off of what the majority of websites said. But I’m not quite sure how this could come into play. I’d be concerned that the exclusion of important works of history could severely limit our access to crucial historical knowledge. For example, I currently am studying Women in the Chinese Enlightenment by Wang Zheng. In it, she provides a reliable argument that the history of the Chinese feminist movement is inherently flawed. The accepted idea among most western scholars is that the Chinese feminist movement was limited and stifled until the Communist Party rose to power, providing emancipation for women. Yet Wang makes a good argument (that apparently has shook the academic community to its core on this particular issue) that not only suggests Chinese feminism thrived during the 1920’s without the help of the CCP (Chinese Communist Party), but that the CCP may have been the political organization that proved problematic for women’s rights. This is not the perspective that most of the web seems to take, and indeed, a search for “Chinese feminism” leads to a multitude of responses which usually discuss different aspects of the CCPs actions towards feminism, barely discussing anything about the Guomindang (the rightist, opposing political faction in China), or independent Chinese feminist organizations that existed before the “liberation” of China in 1949. Based off of this knowledge, and API data mine would give a searcher a potentially very narrow view of China’s feminist history, limiting our ability as historians to discover new facets of history.

But then again, much of the terminology in this article seems very vague and I had a hard time understanding some things. So this assumption could be very wrong. For example, a large database like this could HELP a searcher find a hidden nugget of truth, much like how history can be changed by a person maticulously going through letters in an archive and discover a long forgotten letter everyone had overlooked.

Historical Chart

For my historical chart, I have created a map that lists all of the current nations (except for South Sudan, which Google doesn’t recognize, apparently, and Scotland, which isn’t considered a separate nation from the UK) who’s national bird is an eagle.


Purple indicates a nation with an eagle as it’s national bird; blue indicates a nation with more than one national bird (but where one of the two is an eagle).

One of the interesting things I realized was that, with the exception of the Golden Eagle and the Bald Eage (the national birds of the US, Mexico, and Scotland), all species of eagles are threatened or endangered species.

Eagles are predominantly used in nations with a western culture, likely harkening back to the Roman Empire. For those nations that do not have a western culture (Phillipines, Indonesia, Zambia, and Zimbabwe), the use of the eagle likely correlates to regional and pseudo religious traditions praising the eagle, or because the colonial, imperial powers which had conquered the regions used eagles as a sign of imperialism (in the case of the phillipines).

I expected that eagles would make up a greater portion of national birds. But it makes sense that many nations didn’t choose the eagle. For example, the unofficial national bird of Australia is the emu. This makes sense because it is quintessentially australian. On the other hand, the use of macaws by some central american nations, probably correlates to a desire to increase tourism. And finally, some nations may have purposefully chosen a bird other than an eagle to underscore their new freedoms away from an old, oppressive imperialist system (particularly in South America).

The Power of Points

According to Edward Tufte powerpoint presentations, and other related software, is a plague ruining the intellectual integrity of modern discourse. He describes it thusly:

Imagine a widely used and expensive prescription drug that promised to make us beautiful but didn’t. Instead the drug had frequent, serious side effects: It induced stupidity, turned everyone into bores, wasted time, and degraded the quality and credibility of communication.

“Slideware presentations” was originally used by the military to quickly list bullet points of crucial data during briefings. It seems these crude presentations are the only places they should belong. With it’s rise in use in the academic and corporate worlds, people have lost their abilities to persuasively orate, choosing to present their ideas with low quality graphics instead of passionate speech. Tufte goes so far as to claim that schools, who can spend an entire week on power point presentations, should instead take the week off, “and everyone went to the Exploratorium or wrote an illustrated essay explaining something.”

Peter Norvig seems to agree. On his website he reimagines the Gettysburg address as a power point presentation instead of fiery oration. It effectively captures slideware’s disturbing ineffectiveness at creating emotion and conviction. Simply put, the Gettysburg address in powerpoint form is underwhelming.

Yet how much truth to these arguments are there?

First of all, how should power points be used? Ethan Rotman states, “A speaker needs to carefully decide what to say as well as what not to say to bring the audience to the desired end. The visual aids presented should compliment, not duplicate, the words.” He goes on to explain that one of the common mistakes of power point is, “Projecting their notes or entire script on the screen”

PennState University explains that you should “Simplify and limit the number of words on the screen.” using text “as little as possible.” avoiding “paragraphs” and using “good quality images that reinforce your message.”

According to a communications study at the University of Alabama,

“… teachers who augmented their face-to-face presentations with technology were generally perceived as being more credible than those who did not employ technology.”

Yet they also found,

that augmenting a presentation with bulletpoint text visuals can have a positive effect on audience recall of presented material.

Here we have two opposing view points. One, lead by Tufte and Norvig, stating that powerpoints undercut the importance of effective oration, and another point saying that if powerpoints are used effectively, they increase retention and reinforce your message.

What conclusion can we, astute observers of digital history, make?

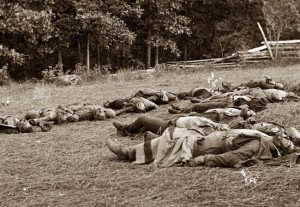
Imagine if Abraham Lincoln utilized such an image when discussing the sacrifices of these men (Source)

Our conclusion must be that utilizing visual-aid-software can increase the impact of the points we’re making, but we need to use the slideware effectively and carefully. It in no way should replace our written or oratory skills, but instead reinforce the arguments we’re making.

As the University of Alabama’s Communication Study suggests, exactly what constitutes as “effective” is up to debate, but in my opinion, if you feel confident enough in your presentation that you felt you could make a strong and powerful case without the aid of slideware, you should be fine.

Feltron Reports: Useless Diatribes on Life

I am going to assume that the purpose of this reading is going to be an analysis of the diagrams, stats, and data presented in the various Feltron Reports.

My first impression of viewing any one of the reports (I quickly went through a few) was that I had no idea what it was talking about. Take the following report as an example:

How Many Triangles Do You See?

First of all, what does the report cover? There is absolutely no explanation. It seems as though one half of the report contains information on Feltron’s play time (specifically how he travelled) in Grand Theft Auto IV, and the other reflects his real life travelling stats. But there’s several significant problems with these stats. First, what sort of measurements are we using? Is this miles, kilometers, meters? Are we actually not measuring distances at all? the first portion of numbers in the upper left under GTAIV gives a list of very small numbers, probably too small to be distances. Are they his kill count on the game? Could all the numbers on the infograph be number of kills racked up in a very prolific travelling year? Or, are we talking about the number of Doritos he ate while gaming or while travelling?

Maybe it’s a statistics on how many badgers gnawed on people’s faces while they were eating Doritos?

The answer to some of these questions may seem obvious – the majority of the report is probably the amount of travel Felton did over the course of a year. But this still brings up the all important question of measurement, and it doesn’t explain the upper left quadrant of numbers.

There’s also an issue with the format. The font of the statistics (the most important part of any infograph) is way too small. Then there are those bloody triangles. Does size denote importance of the statistic? How about color? Is there any significance to the way the triangles fall off eachother, always connecting to the left/right side of the bottom corners? These are just a few of the reasons why this infograph is abysmal. While Felton does continue his report and elaborate on these statistics, I still find it inexcusable that he doesn’t label is graphics better. Further, I’m having much more of a discussion on the content of graphically presented information verses the exact layout of his reports. Even if I were, I’d be probably even more critical. The front page does not do a good job explaining what the contents of the report will be and seems to lack sufficient resources to convey what Feltron will discuss. Everything I saw had to do with travel, sure, but very little of it had to do with things like total miles traveled. I saw nothing about GTAIV. It’s like a weak thesis statement which only says, “This paper will be discussing total distance traveled and random facts from my time playing GTA.” and yet the paper discusses much more than just total distance traveled and never gets around to talking about GTA.

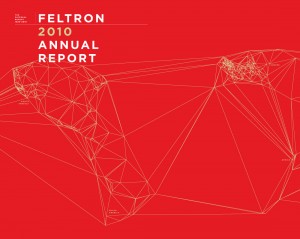
The second Feltron report I read was the 2010 report.

An encapsulation of my confusion, as communicated by randomly drawn white lines

At least this one has a small caption at the bottom which makes this nonsensical web of lines, equipped with seemingly random allocations of geographic polities, have some symbolical meaning. Felton writes, “The 2010 Annual Report is an encapsulation of my father’s life, as communicated by the calendars, slides and other artifacts in my possession.” Once again, we’re faced with a poorly designed infograph. I’m assuming the lines represent places Felton’s father has been, North America, South America, Africa, and Europe. But they could also represent places which have influences his fathers life. It’s also difficult to tell where he’s been. I could take some guesses: Cape Town, Ethiopia, England, New York, California, Brazil, etc. It seems to me that Canada was completely left off, and the lines between North and South America could be pointing to any combination of places ranging from strictly the Carribean to strictly Mexico/Central America, to some hybrid of both. Finally, while there’s a little caption at the bottom explaining what the infograph/report is/will be about, I’m not a believer in captions. Your infograph should present the information needed to have a full understanding of the information presented. Again, this opening infograph should act as a sort of a thesis, or at least an interesting title, and Felton fails to truly capture a readers attention.

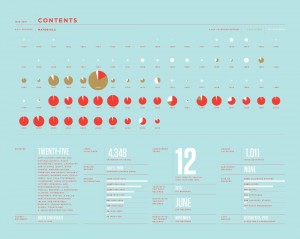
However, Felton does get better immediately on the next slide:

Interestingly, my dad has been to more countries, yet I doubt his experience would be as fun to tell.

The information presented is extremely straightforward. The pie charts do an excellent job of describing what sources were used to compile the report, when they were used, and the quantity from each year used. The pie charts only display three colors, which keeps it neat and concise. At the bottom are interesting factoids from the reports, such as total number of countries visited, number of years without records, the month with the most/least records, etc. My only complaint is with some of the pie charts. A few of them are so small, it’s difficult to get any information out of them. It would have helped to make them a little larger.

All in all, despite some horrifically bad infographs, the Feltron report is still interesting. Nicholas Felton seems to forget two very basic principle of compiling and displaying data (whether in writing, graphical presentations, speeches… pretty much displaying it in anyway): if it’s not relevant/doesn’t get the point across, don’t publish it; and, keep it both as clear and concise as possible. For example, what’s the point of the white lines on the cover of the 2010 report? It’s probably the most concise thing in that report, but it is not clear. This is something we as a class need to remember as we move forward and practice creating our own data sets.


Page 1 of 3:1 2 3 »